Average Return: Meaning, Calculations and Examples
 Автор:
 What Is Average Return? The average return is the simple mathematical average of a series of returns generated over a specified period of time. An …
What Is Average Return? The average return is the simple mathematical average of a series of returns generated over a specified period of time. An …
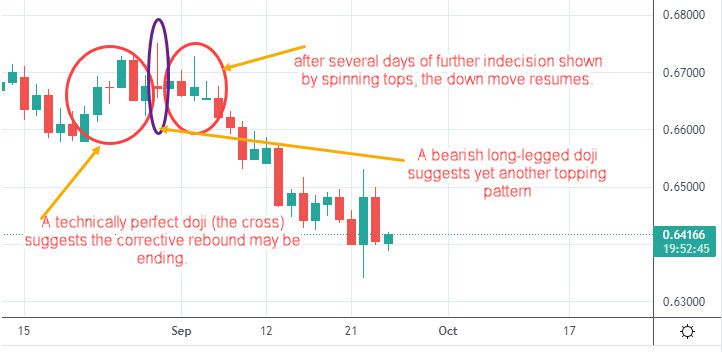
Price patterns are seen in identifiable sequences of price bars shown in technical analysis charts. These patterns can be used by to examine past price …
Some traders and investors denounce technical analysis (TA) as a superficial study of charts and patterns without any concrete, conclusive or profitable results. Others believe it is …
Candlestick Pattern Explained Candlestick charts are a technical tool that packs data for multiple time frames into single price bars. This makes them more useful …
Fundamental vs. Technical Analysis: An Overview In trading, investing, and finance, two approaches help investors analyze markets and securities: fundamental and technical analysis. Each helps …
Candlestick charts originated in Japan over 100 years before the West developed the bar and point-and-figure charts. In the 1700s, a Japanese man named Homma discovered that, …
In addition to chart patterns and indicators, technical analysis involves the study of wide-ranging topics, such as behavioral economics and risk management. The goal behind …
Technical indicators are used by traders to gain insight into the supply and demand of securities and market psychology. Together, these indicators form the basis …
A vital part of a trader’s success, especially those who trade frequently, is the ability to evaluate patterns in trading data. Technical analysis techniques can …
The Supertrend Indicator is a technical analysis tool that can assist investors in identifying market trends. Developed by Olivier Seban, the indicator is useful for …